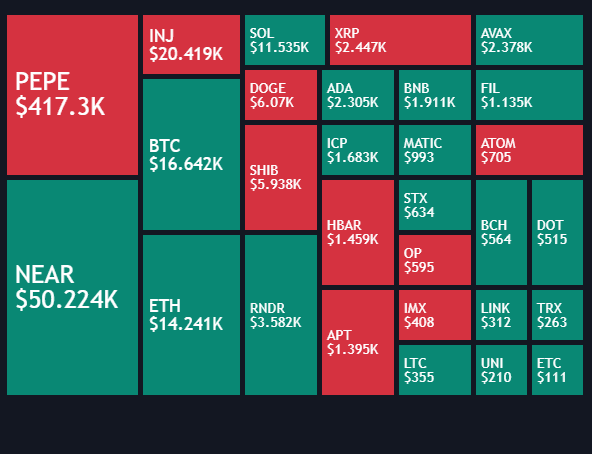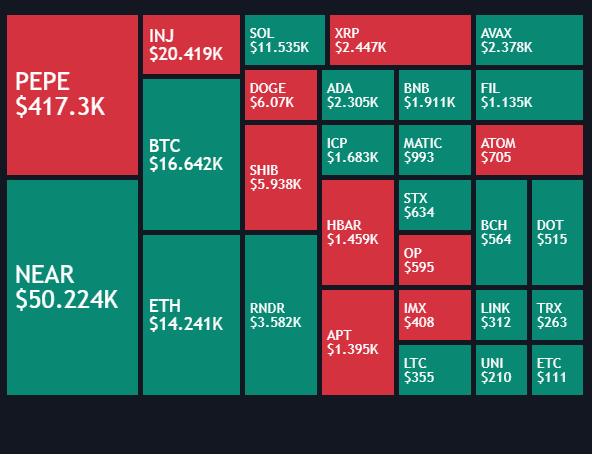
A Bitcoin Liquidation Heatmap is a visual representation that helps traders identify potential price levels where a large number of leveraged Bitcoin positions are likely to be forcibly closed, or ‘liquidated.’ Think of it like a weather map for the crypto market, but instead of showing rain or sunshine, it highlights areas of high liquidation risk.
What Exactly is Liquidation in Crypto?
Before we dive deeper into the heatmap, let’s quickly understand what liquidation means in the context of cryptocurrency trading. When you trade with leverage, you’re essentially borrowing funds to amplify your trading position. While this can magnify profits, it also significantly increases your risk. If the market moves against your leveraged position to a certain point, your collateral might no longer be sufficient to cover potential losses. At this point, the exchange automatically closes your position to prevent further losses, and this is what we call liquidation.
How Does a Liquidation Heatmap Work?
Liquidation heatmaps aggregate data from various cryptocurrency exchanges to show where these liquidation levels are concentrated. They typically display different colors to indicate the density of liquidation points at specific price levels. For instance, warmer colors (like yellow or red) usually signify a higher concentration of potential liquidations, while cooler colors (like blue or green) suggest fewer. These maps are dynamic, constantly updating as market conditions and leveraged positions change.
The data used to construct these heatmaps includes information on open interest, leverage ratios, and the average entry prices of leveraged positions. Algorithms then process this data to pinpoint the exact price levels where a cascade of liquidations could occur. When Bitcoin’s price approaches these
hot zones, it can trigger a chain reaction, as liquidations at one level can push the price further, leading to more liquidations. This phenomenon is often referred to as a ‘liquidation cascade’ or ‘liquidation squeeze.’
Why Are Liquidation Heatmaps Important for Traders?
For traders, especially those involved in leveraged trading, liquidation heatmaps are invaluable tools. They offer a glimpse into the market’s potential vulnerabilities and can help in several ways:
•Identifying Support and Resistance Levels: Areas with high liquidation density can act as significant support or resistance levels. If the price approaches a zone with many long liquidations, it might find temporary support as those positions are closed. Conversely, a cluster of short liquidations could act as resistance.
•Risk Management: Understanding where potential liquidations lie helps traders manage their own risk. By being aware of these levels, they can adjust their stop-loss orders or take profit targets to avoid being caught in a liquidation cascade.
•Strategic Entry and Exit Points: Heatmaps can assist in identifying optimal entry and exit points. For example, a trader might wait for a price dip into a high liquidation zone, anticipating a bounce back after the liquidations clear.
•Market Sentiment: The heatmap can also provide insights into overall market sentiment. A large build-up of leveraged positions, especially in one direction, can indicate over-leveraging and potential instability.
Limitations and Considerations
While liquidation heatmaps are powerful, they are not foolproof. Here are some things to keep in mind:
•Not a Crystal Ball: Heatmaps are predictive tools based on current data, but they don’t guarantee future price movements. Unexpected news or events can always override technical indicators.
•Data Accuracy: The accuracy of a heatmap depends on the quality and completeness of the data it aggregates. Different platforms might have slightly varying data, leading to minor discrepancies.
•Dynamic Nature: The market is constantly evolving, and so are liquidation levels. What was a significant liquidation zone an hour ago might be less relevant now. Traders need to use these maps in real-time and combine them with other analytical tools.
•Over-reliance: Relying solely on liquidation heatmaps without considering other fundamental and technical analysis can lead to poor trading decisions. They are best used as one tool in a comprehensive trading strategy.
In conclusion, Bitcoin Liquidation Heatmaps offer a fascinating and useful perspective on the leveraged crypto market. By visualizing potential liquidation zones, they empower traders with additional insights for risk management and strategic decision-making. However, like all trading tools, they should be used judiciously and in conjunction with a broader understanding of market dynamics.

FAQs
Q: What is a Bitcoin Liquidation Heatmap? A: A Bitcoin Liquidation Heatmap is a visual tool that displays price levels where a high concentration of leveraged Bitcoin trading positions are at risk of being automatically closed, or liquidated, by exchanges.
Q: How do I read a Liquidation Heatmap? A: Heatmaps typically use a color gradient to indicate the density of liquidation points. Warmer colors (like yellow or red) usually signify areas with a higher volume of potential liquidations, while cooler colors (blue or green) suggest fewer.
Q: Are Liquidation Heatmaps always accurate? A: No, they are predictive tools based on current data and market conditions. While they offer valuable insights, they are not foolproof and should be used in conjunction with other analytical methods. Unexpected market events can always influence price movements.
Q: Can I use a Liquidation Heatmap for day trading? A: Yes, many day traders use liquidation heatmaps to identify potential support and resistance levels, manage risk, and pinpoint strategic entry and exit points. However, it’s crucial to remember their limitations and combine them with other trading strategies.
Q: Where can I find a Bitcoin Liquidation Heatmap? A: Several cryptocurrency data platforms and exchanges offer liquidation heatmaps as part of their analytical tools. Some popular ones include CoinGlass, Hyblock Capital, and others.
Disclaimer: Not Financial Advice
RELATED POSTS
View all


